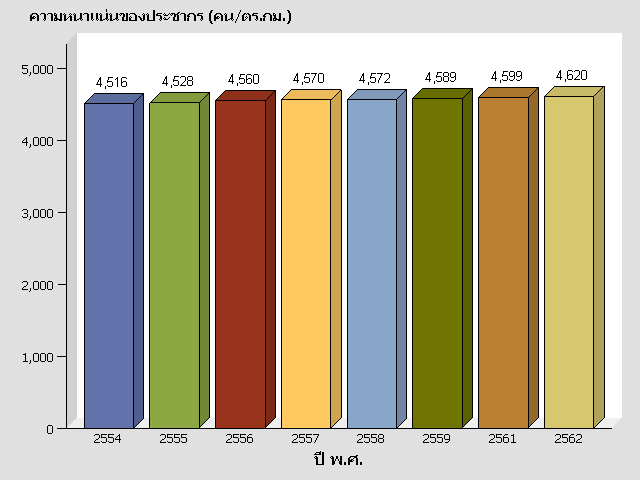
This graph is a 3-D vertical bar chart of 'ปี พ.ศ.', with a sum response variable of 'ความหนาแน่นของประชากร (คน/ตร.กม.)'.
The following table contains the data from the graph:
| ปี พ.ศ. |
ความหนาแน่นของประชากร (คน/ตร.กม.) (sum) |
|---|
| 2554 | 4,516 |
| 2555 | 4,528 |
| 2556 | 4,560 |
| 2557 | 4,570 |
| 2558 | 4,572 |
| 2559 | 4,589 |
| 2561 | 4,599 |
| 2562 | 4,620 |